
Introduction#
I needed to use Datadog at work but was a complete beginner and had to ramp up quickly. I decided to use the Datadog Learning Center to learn the basics. This post summarizes what I learned through the platform.
Motivation#
Two goals:
- Understand Datadog’s core concepts
- Learn Datadog’s basic operations
What Is the Datadog Learning Center?#
Learn by coding on real cloud compute instances on our free interactive platform. Confidently monitor, scale, and secure your applications whether you’re a beginner or an experienced developer, an operations pro, or a security expert.
In short, it’s a free service that lets you learn Datadog’s features through hands-on labs. Currently, 54 courses are available. I started with the popular courses. Here’s a quick overview of each:
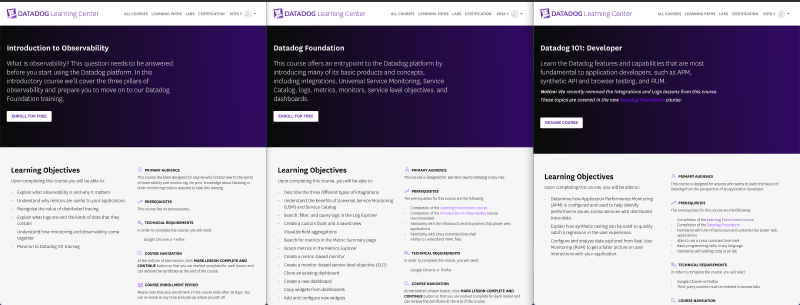
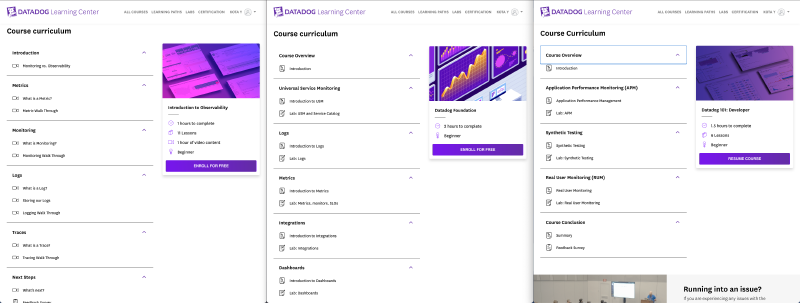
ref. Introduction to Observability, Datadog Foundation, Datadog 101: Developer
- Introduction to Observability – Lecture-based
- Datadog Foundation – Hands-on (SRE-focused)
- Datadog 101: Developer – Hands-on (backend engineer-focused)
I decided to work through them top to bottom. This post covers Introduction to Observability and Datadog Foundation. (Datadog 101: Developer is left for future study.)
Introduction to Observability#
This section explains the fundamentals: what Datadog can do, and what Observability, Monitoring, Metrics, Traces, and Logs mean and why they matter.
| Concept | Description |
|---|---|
| Metrics | Quantitative data representing system state – think of it as capturing “points” |
| Traces | Information about request paths and processing times – think of it as capturing “lines” |
| Logs | Timestamped information about the system |
| Observability | Understanding what is happening and why from collected data |
| Monitoring | Collecting information to understand system state (a subset of Observability) |
The text can be hard to visualize, but this diagram makes it clear:
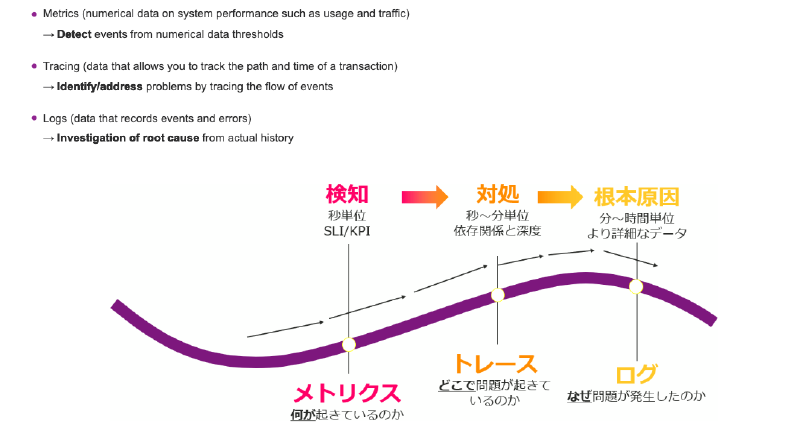
ref. Macnica - Observability Overview
Datadog is an all-in-one observability tool that collects Metrics, Traces, and Logs. With Datadog, you can visualize them like this:
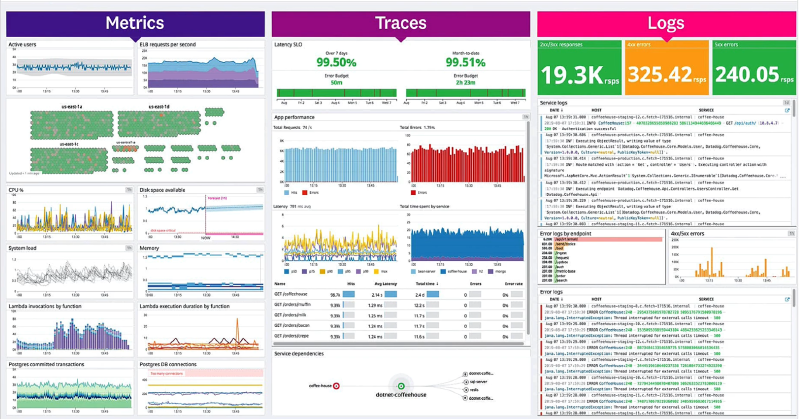
ref. Datadog Learning Center - Monitoring vs Observability
In summary:
- Metrics → what is happening
- Traces → where it’s happening
- Logs → why it’s happening
These are the three pillars of observability, and Datadog provides tools to visualize all of them.
Datadog Foundation#
With the observability concepts understood, let’s move on to Datadog’s basic operations.
https://learn.datadoghq.com/courses/datadog-foundation
The course covers:
- Describe the three different types of integrations
- Understand the benefits of Universal Service Monitoring (USM) and Service Catalog
- Search, filter, and query logs in the Log Explorer
- Create a custom facet and a saved view
- Visualize field aggregations
- Search for metrics in the Metric Summary page
- Graph metrics in the Metrics Explorer
- Create a metric-based monitor
- Create a monitor-based service level objective (SLO)
- Clone an existing dashboard
- Create a new dashboard
- Copy widgets from dashboards
- Add and configure new widgets
Universal Service Monitoring#
https://www.datadoghq.com/product/universal-service-monitoring/
Universal Service Monitoring (USM) is a Datadog feature that monitors your entire service without any code changes. Under the hood, it uses eBPF. To enable USM, you need to properly configure the Datadog Agent and Unified Service Tagging. Data collected by USM is viewable in the Service Catalog.
As a side note, observability approaches can be broadly categorized into Push-based and Pull-based. Datadog uses an installed Agent, making it Push-based. An example of Pull-based is Prometheus.
Logs#
https://docs.datadoghq.com/getting_started/logs/
Datadog centrally manages logs collected from multiple sources. Here’s how the main operations work:
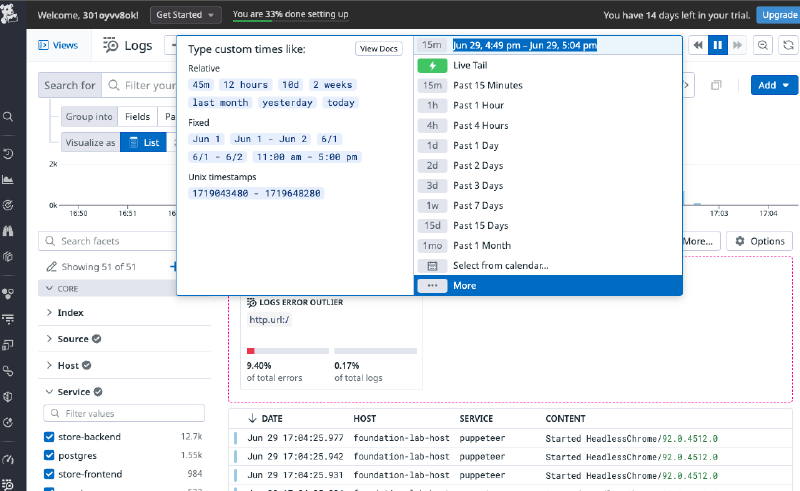
Time Range
Filter logs by time period.
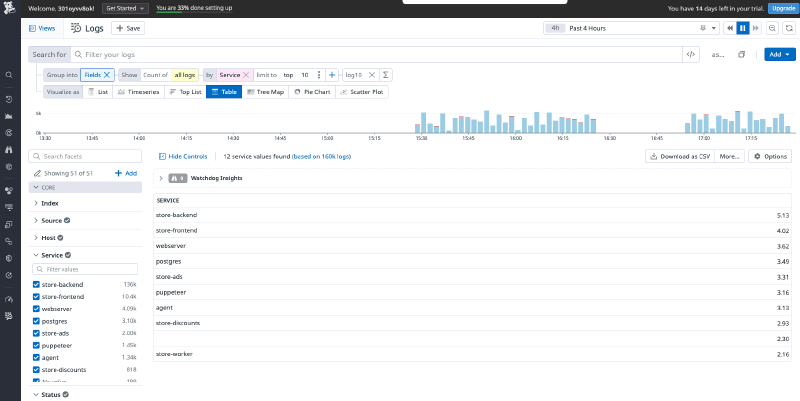
Fields
Filter which logs to display.
Log Tags
Each log has tags that can be used for filtering.
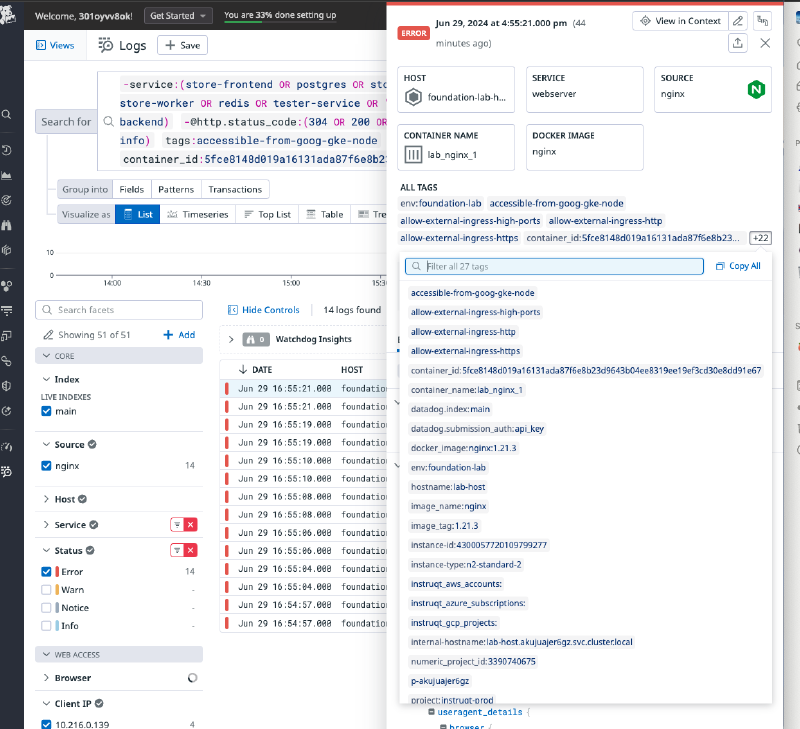
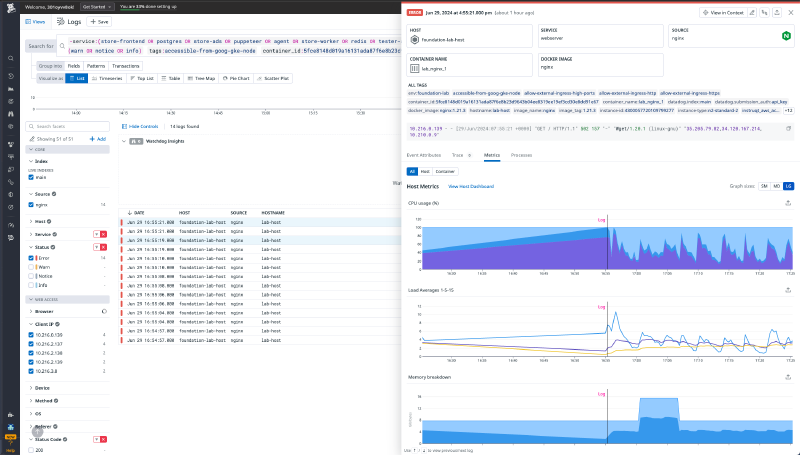
Event Attributes
View log attributes in JSON format.
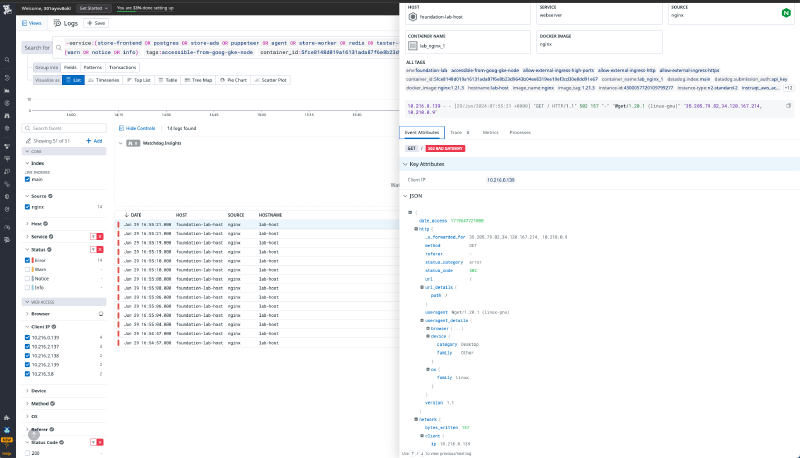
Metrics
Display metrics collected at log ingestion time.
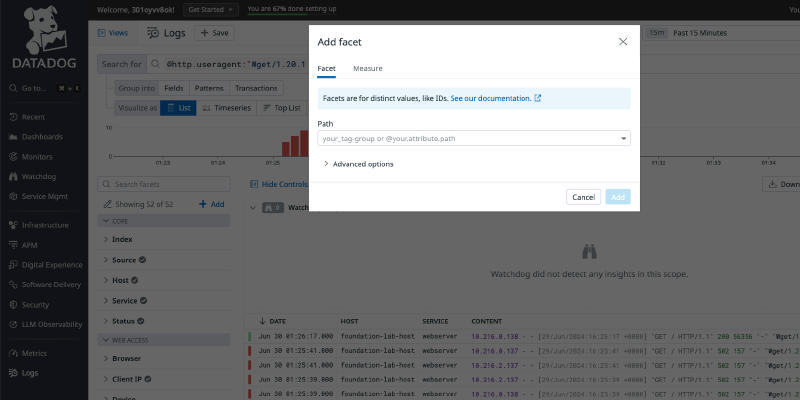
Custom Facets
Create your own filtering criteria.
Metrics#
https://docs.datadoghq.com/getting_started/monitors/
In Datadog, metrics are represented as timestamp-value pairs. Closely related concepts include Monitors and Service Level Objectives (SLOs). Monitors send notifications when metrics fall outside defined thresholds. SLOs are indicators for quantitatively evaluating service quality, tracked over extended periods.
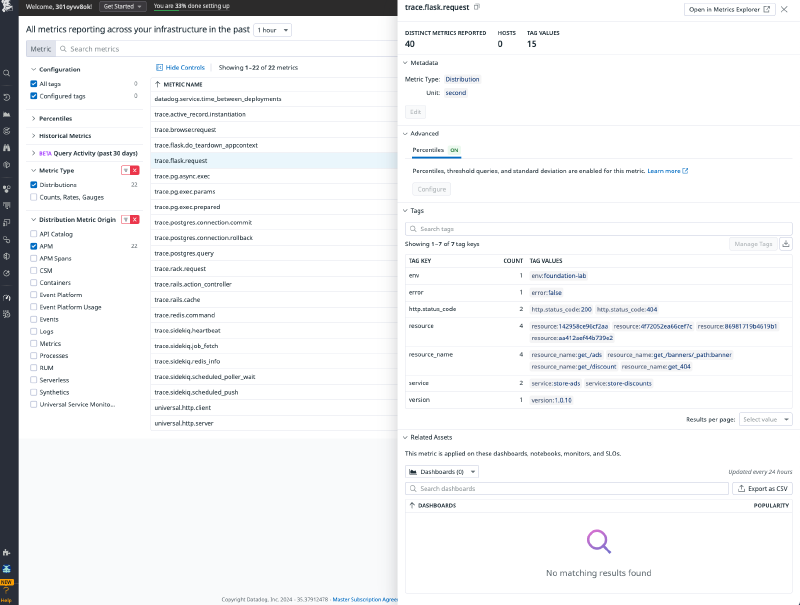
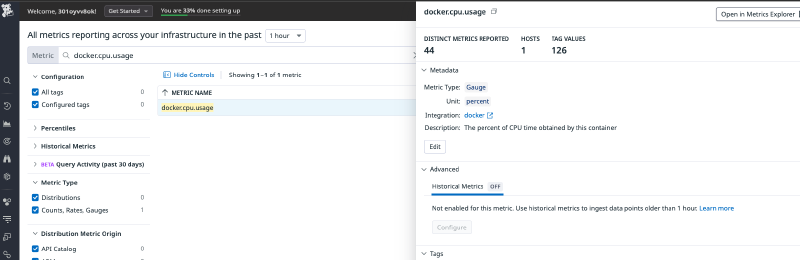
Facet Panel and Metric Details Side Panel
View detailed information about metrics.
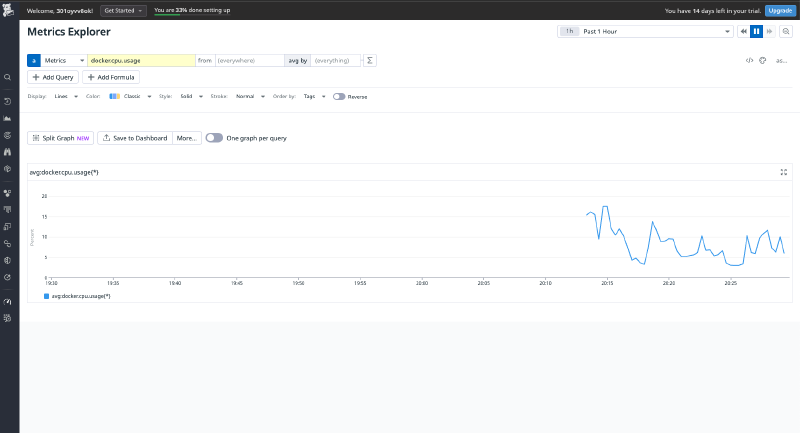
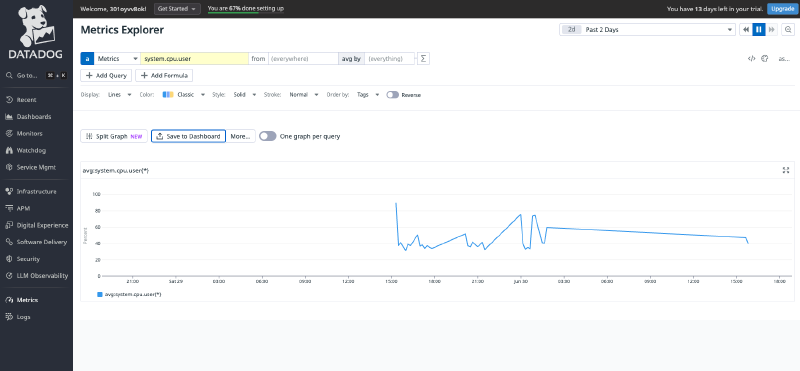
Metrics Visualization
Visualize metrics as graphs.
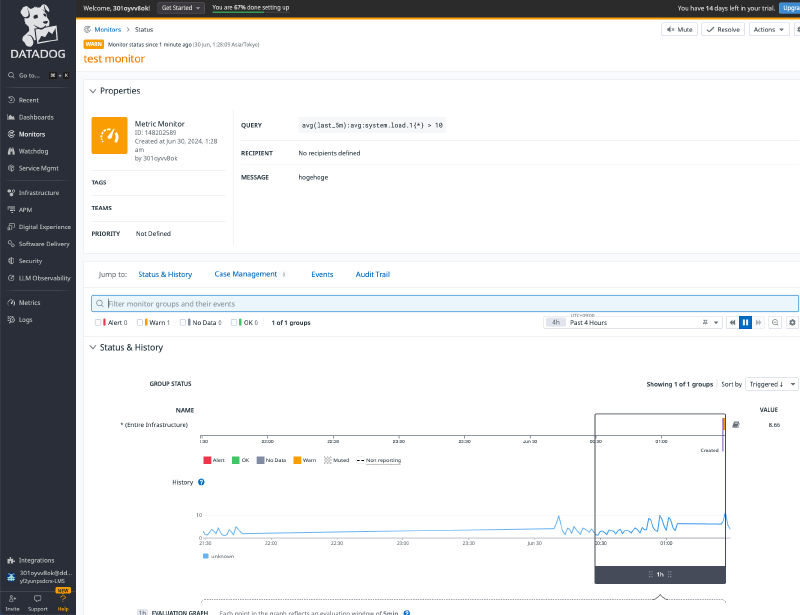
Creating a Metrics-Based Monitor
Create a monitor based on a metric.
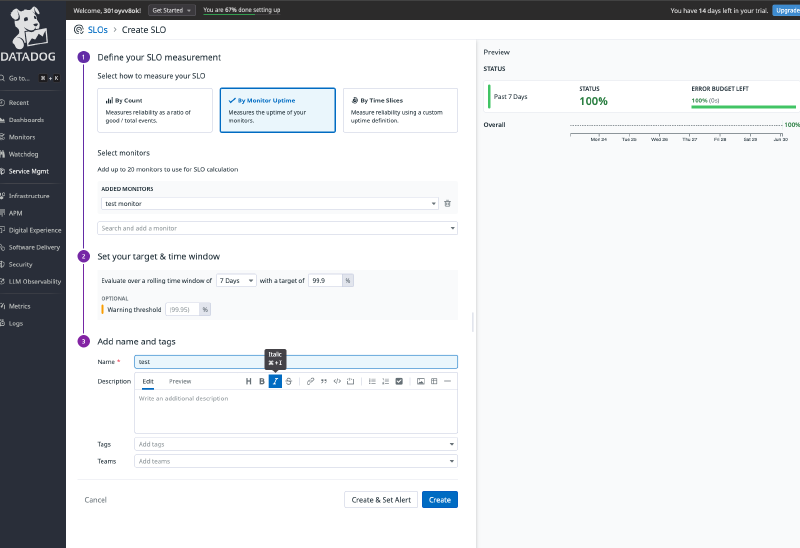
Creating a Monitor-Based SLO
Create an SLO based on a monitor.
Integrations#
https://docs.datadoghq.com/getting_started/integrations/
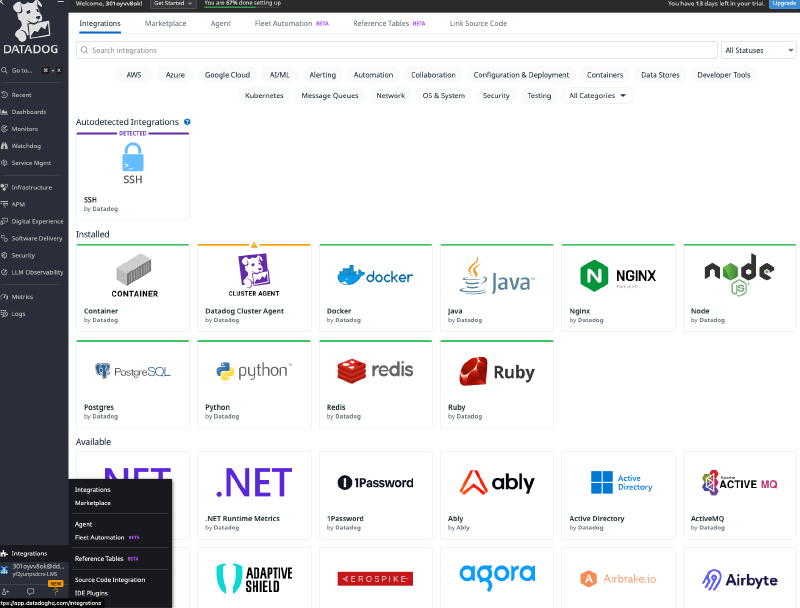
Datadog has three integration types:
- Agent-based integrations are installed with the Datadog Agent and use a Python class method called
checkto define the metrics to collect.- Authentication (crawler) based integrations are set up in Datadog where you provide credentials for obtaining metrics with the API. These include popular integrations like Slack, AWS, Azure, and PagerDuty.
- Library integrations use the Datadog API to allow you to monitor applications based on the language they are written in, like Node.js or Python.
Details for each integration are available here.
Integration List and Configuration
Dashboards#
https://docs.datadoghq.com/dashboards/
Dashboards are Datadog’s flagship feature for displaying collected data in various formats – charts, tables, notes, and more.
Cloning a Dashboard
Copy an existing dashboard to create a new one.
Source dashboard: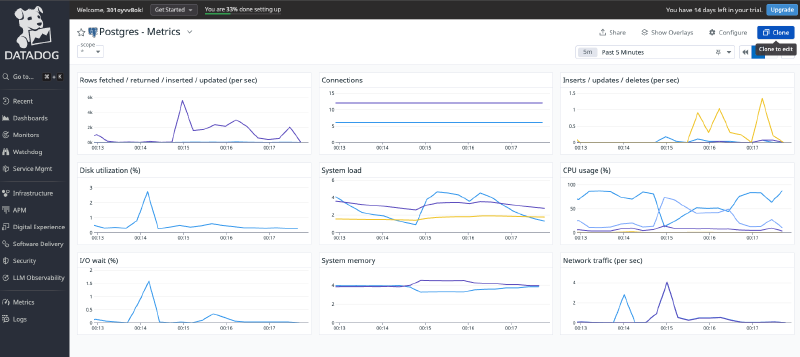
Cloned dashboard: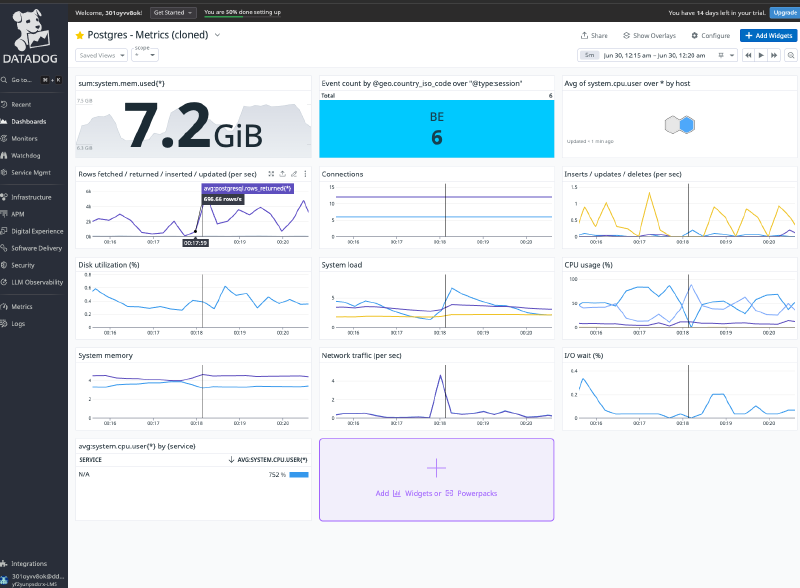
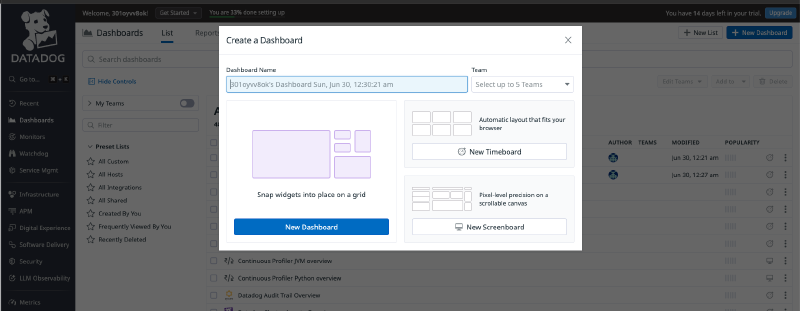
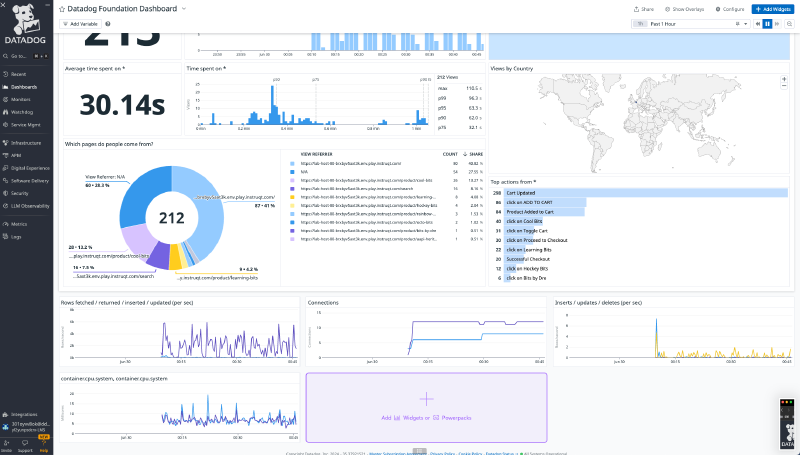
Creating a New Dashboard
Create a dashboard from scratch.
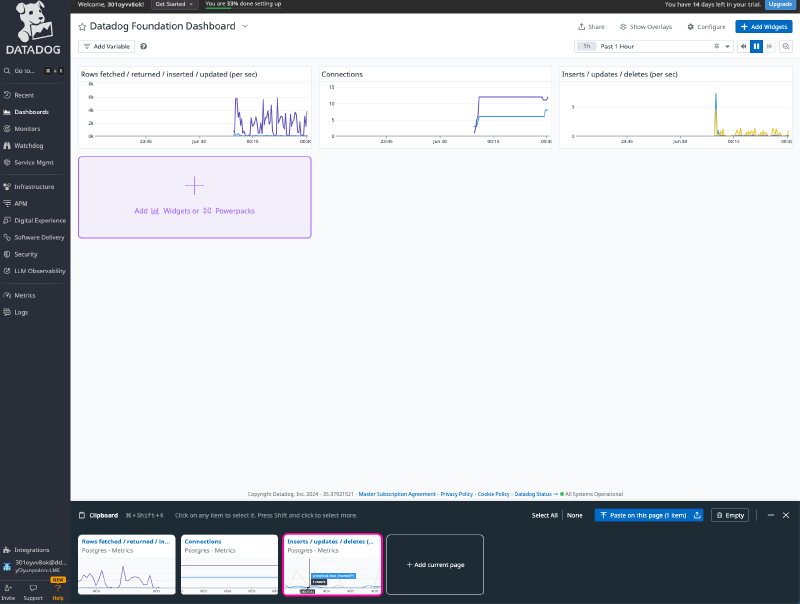
Copying Widgets
Use Cmd+C/V to copy and paste widgets, and Cmd+Shift+K to check the clipboard.
Adding Widgets
Add new widgets to your dashboard.
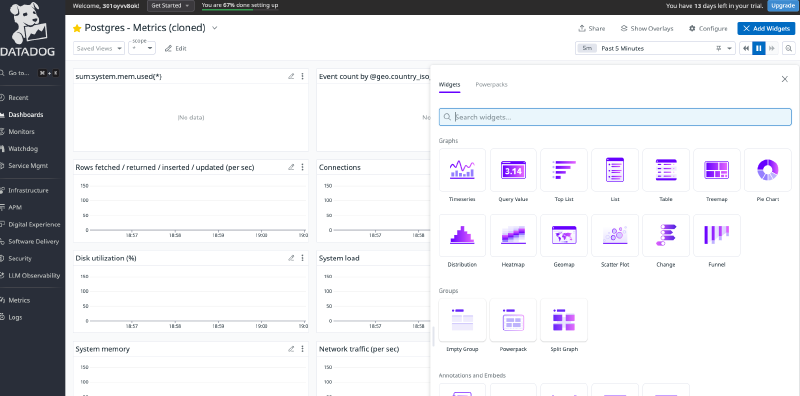
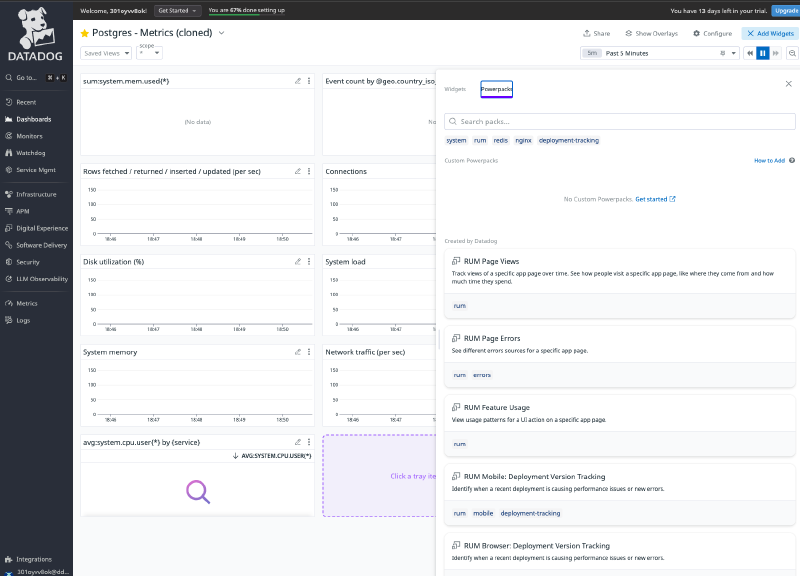
You can also use Powerpack Widgets to easily add advanced widgets.
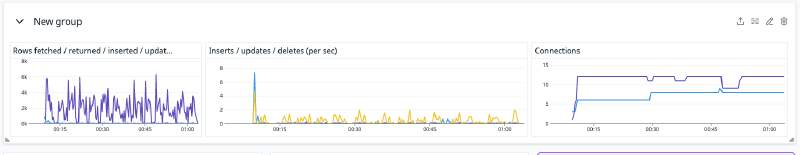
Grouping
Use Cmd+G to group widgets. Ungroup by dragging and dropping.
Metrics Explorer to Dashboard Export
Create metrics in Metrics Explorer and export them directly to a dashboard.
Summary#
Through the Datadog Learning Center, I was able to learn Datadog’s fundamental operations and concepts. The entire curriculum can be completed in a single day, so I highly recommend giving it a try if you’re interested.